MapleCub Data Lab · Province data · 2026
How many licensed daycares are in Alberta?
Alberta publishes more child-care inspection data than every other province in this dataset combined, several times over.
- Computed 2026-08-10
- N = 2,912 Alberta programs
- 20,516 across eight registries
- CC BY 4.0
2,912
licensed programs
11.1
per 1,000 children aged 0–4
239
communities with licensed care
45.2%
of them have exactly one option
The short answer, with everything behind it
As of 2026-08-10, MapleCub counts 2,912 licensed child-care programs in Alberta — 2,771 centres and 141 licensed family homes. That is 11.1 licensed programs for every 1,000 of the province’s 262,923 children aged 0–4, the fifth-highest rate of the eight provinces that publish a licensing registry. They sit in 239 communities; 108 of those (45.2%) have exactly one licensed program and no second choice, while 63.9% of the province’s licensed programs are in its five largest cities.
Alberta publishes licensed capacity in its open data: 222,932 spaces behind those programs. Alberta’s 2026 price position: ≈$15/day. Flat parent fee of $326.25/month for full-time care (100 or more hours per month) and $230/month part-time at providers taking affordability funding, since April 1, 2025. Not yet $10/day. Which individual programs offer that price is not distinguishable from public registry data — no affordability-grant field in the open data — so every row in the file carries the same value.2†,1
On inspections, Alberta is one of the three provinces that publish records as open data: as extracted on 2026-07-05, 15,566 records covering 2,874 facilities, July 2024 – December 2025. The source is a rolling 18-month window refreshed quarterly, so today's file will differ. Online, MapleCub has matched 2,305 of Alberta's 2,912 programs to a Google place record (79.2%), and 861 of those (37.4%) carry a rating, averaging 4.60 across 23,243 parent reviews. 1,076 programs (37%) have a website recorded in the frozen quarterly snapshot. Because match coverage here is above 60%, the rated share is a statement about Alberta and not only about our queue: even if every unmatched listing turned out to be rated, the province would top out at 50.7%.2†
Source: MapleCub Canadian Childcare Dataset — Aug 2026 · computed 2026-08-10 · N = 2,912 · CSV · Alberta; visible listings only
The numbers
| Measure | Value | What it means |
|---|---|---|
| Licensed programs | 2,912 | 14.2% of the 20,516 licensed programs across the eight provinces that publish registries. |
| Centres | 2,771 | 95.2% of the province’s licensed programs. |
| Licensed family homes | 141 | 4.8% of the province’s licensed programs. Whether homes appear at all is a licensing rule, not a measure of how much home care exists. |
| Children aged 0–4 | 262,923 | Statistics Canada, Table 17-10-0005-01 (July 1, 2025 estimates)3 |
| Programs per 1,000 children | 11.1 | Licensed points of access a parent can look up, not licensed spaces. Registries differ in what they record, so read it alongside the provider mix above. |
| Communities with licensed care | 239 | A community is a normalized city name — lower-cased and trimmed — so registry case variants do not count twice. |
| Communities with exactly one option | 108 (45.2%) | One licence serves the whole community: no comparing, no waitlist hedging, no second choice. |
| Share in the five largest cities | 63.9% | How concentrated the province’s licensed supply is in its biggest municipal markets. |
| Published licensed capacity | 222,932 spaces | Stated in the province’s own machine-readable file, so spaces can be counted here and in only two other provinces.2† |
| Inspection records | 15,566 records, open data | Inspection records covering 2,874 facilities, July 2024 – December 2025, as extracted on 2026-07-05.2† |
| Programs with a website | 1,076 (37%) | Harvested conservatively, requiring name agreement, so this undercounts rather than overcounts. |
| Matched by MapleCub to a Google place | 2,305 (79.2%) | Above the 60% floor this Lab requires before it will say anything about a province's own visibility. |
| Rated among the matched | 861 of 2,305 (37.4%) | Average 4.60 out of five across 23,243 parent reviews. Across ALL of Alberta's listings the rated share is 29.8% — a floor set by our matching, and a ceiling of 50.7% if every listing we never matched turned out to be rated. |
Source: MapleCub Canadian Childcare Dataset — Aug 2026 · computed 2026-08-10 · N = 2,912 · CSV · child population: Statistics Canada, Table 17-10-0005-01 (July 1, 2025 estimates)
How Alberta compares on supply
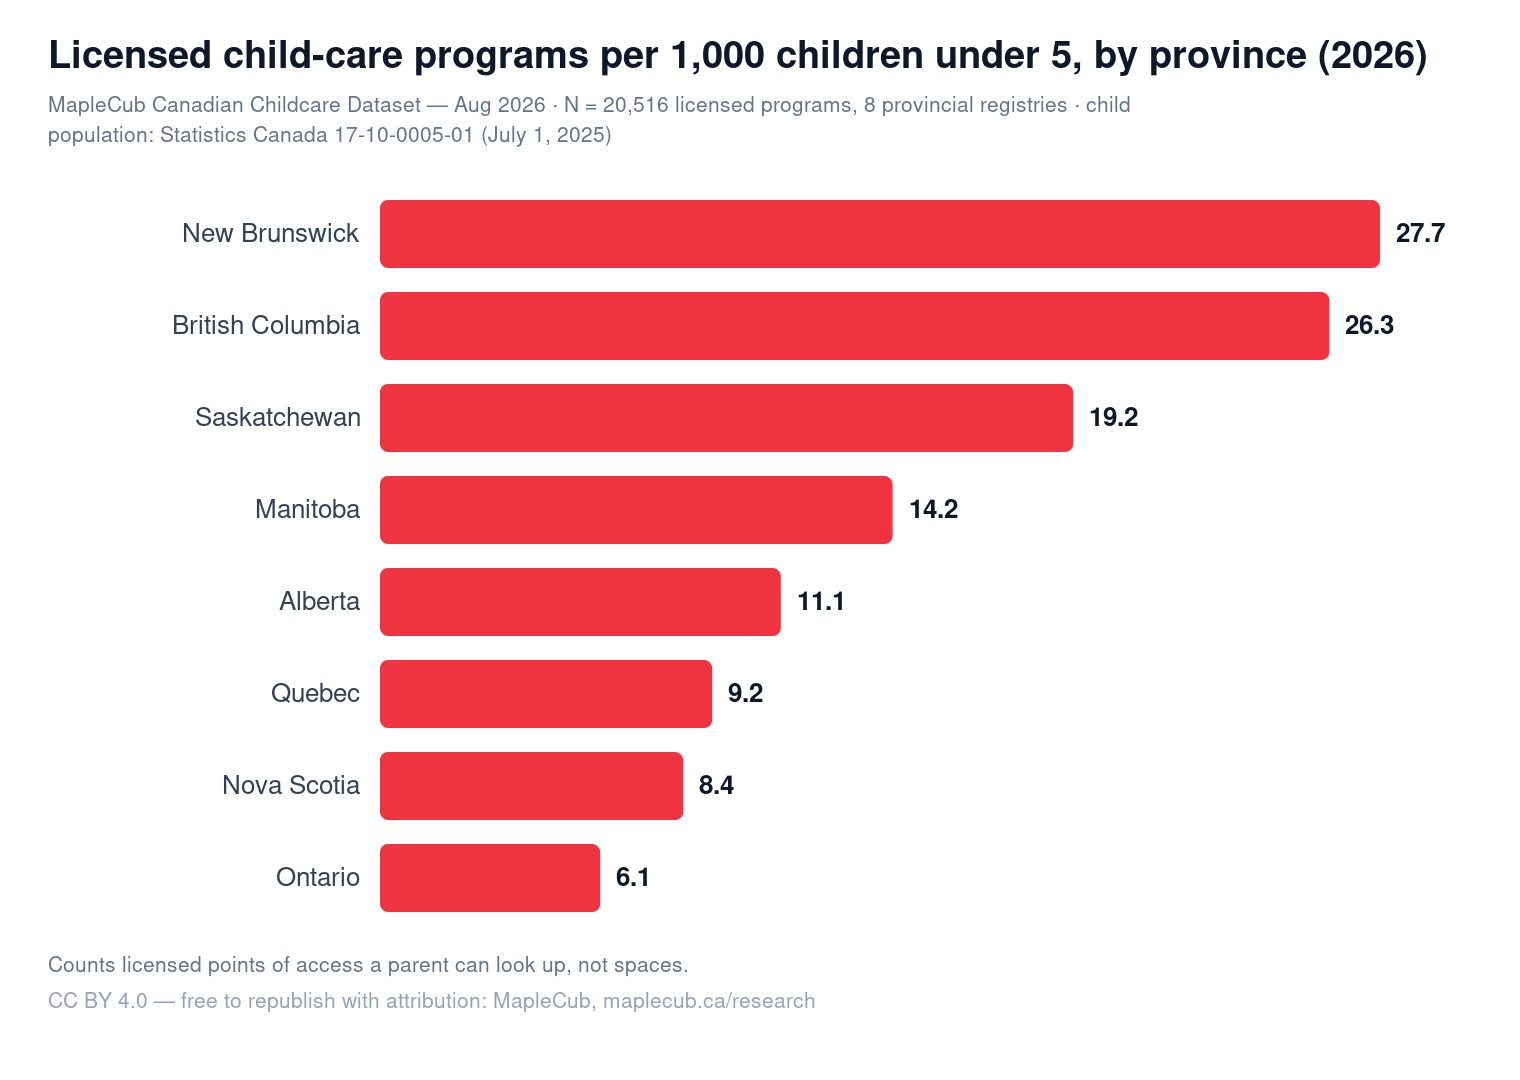
Alberta comes in at 11.1, between New Brunswick’s national high of 27.7 and Ontario’s national low of 6.1. Licensed programs per 1,000 children aged 0–4 is the cleanest cross-province supply signal this dataset supports, and it has to be read with the registry differences in mind: some provinces license each family home individually, others license home care through agencies that never appear as separate records.
Source: MapleCub Canadian Childcare Dataset — Aug 2026 · computed 2026-08-10 · N = 20,516 · CSV · child population: Statistics Canada, Table 17-10-0005-01 (July 1, 2025 estimates)3
What makes Alberta’s registry different
As extracted on 2026-07-05, 15,566 inspection and enforcement records cover 2,874 of its 2,912 licensed programs across July 2024 – December 2025: 11,770 routine inspections, 2,274 follow-ups and 1,522 complaint-triggered visits. The published file is a rolling 18-month window refreshed quarterly, so today's file will differ. Nova Scotia and Quebec, the other two open-data provinces, publish 645 and 730 records between them. Alberta also states licensed capacity — 222,932 spaces, school-age care included — which puts it in the same three-province minority twice.
The supply picture is concentrated. 63.9% of Alberta’s licensed programs are in five cities, and 108 of its 239 communities (45.2%) have exactly one licensed program. Provincial averages are doing a lot of work in a province shaped like that.
What Alberta does not publish is price. Its open data carries inspection and enforcement fields and no affordability-grant field, so the flat monthly parent fee — the number a family actually needs before signing anything — cannot be attached to a named facility. Precise about conduct, silent about cost.
Source: MapleCub Canadian Childcare Dataset — Aug 2026 · computed 2026-08-10 · N = 2,912 · CSV · registry structure and published fields as documented by each province
Where to go from here
Alberta beyond the arithmetic: the programs themselves, and the rules behind them.
- Licensed daycares in Alberta — browse the 2,912 programs themselves, with age, hours and subsidy filters.
- What child care costs in Alberta — the fee rules and subsidy thresholds behind the price line above, with official sources.
- Alberta’s one-option communities — the 108 places with a single licensed program, named.
- $10-a-day: claimed vs. measured — what the registries can and cannot confirm about the price each province advertises.
- The State of Licensed Child Care in Canada, 2026 — the national report these figures were computed for.
- Calgary child care in numbers — the city snapshot, 861 licensed programs.
Cite as: MapleCub, “Alberta child care by the numbers, 2026,” 2026-08-10, https://www.maplecub.ca/research/alberta-child-care-data. Released under CC BY 4.0. More open data: MapleCub Data Lab.
Sources
Every external claim in this report — every dollar figure, every inspection count, every rule — is cited to the government page it came from. Each entry records the publisher, the document, and the date we last fetched it. Sources were audited 2026-08-11. A dagger (†) marks the 1 sources that need a caveat: either the source has been updated since our figure was computed, or we could not open the page ourselves and have said so. The reason is printed with the entry.
- 1. Government of Alberta — Education and Childcare · Childcare fees · fetched 2026-08-11 · https://www.alberta.ca/childcare-fees
- 2†. Government of Alberta — Open Government Program · Child Care Information [2021 to current] · fetched 2026-08-11 · https://open.alberta.ca/opendata/childcareinformation† Source has moved on since our figure was computed. Our number is published as a dated extract, not as the current record.
- 3. Statistics Canada · Table 17-10-0005-01 Population estimates on July 1, by age and gender · fetched 2026-08-11 · https://www150.statcan.gc.ca/t1/tbl1/en/tv.action?pid=1710000501