MapleCub Data Lab
Open data on Canadian licensed child care
No federal body publishes a count of Canada’s licensed child-care programs. We build one from the eight provincial licensing registries, deduplicate it, locate it as precisely as each registry allows, and publish the result — including how precise that turned out to be — for anyone to check or reuse.
- Computed 2026-08-10
- N = 20,516 programs
- 8 provincial registries
- CC BY 4.0
2,175
communities with licensed care
1,074
have exactly one licensed option
3 of 8
provinces publishing licensed capacity
Where Canada has licensed child care at all, half the time there is exactly one
2,175 communities across 8 provinces have at least one licensed programme. In 1,074 of them, that is the only one.
exactly one licensed programmetwo or moreone square = one community
Read this as concentration, not as a ranking of how well a province serves families. Provinces that license family child-care homes one at a time record several licences in a village where an agency-based province records none.
Source: MapleCub Canadian Childcare Dataset — Aug 2026 · computed 2026-08-10 · N = 2,175 · CSV · community = normalized registry city name within a province
The current edition covers 20,516 licensed programs across 2,175 communities in British Columbia, Ontario, Quebec, Alberta, Saskatchewan, Manitoba, New Brunswick and Nova Scotia, computed 2026-08-10. Everything the Lab publishes is released under CC BY 4.0 — use it, quote it, chart it; credit MapleCub and link back. Editions are quarterly and each keeps the date it was computed on, so an old citation stays honest.
Machine-readable JSON for developers: /data/state-of-child-care-2026.json — same figures as the CSV, same licence.
Source: MapleCub Canadian Childcare Dataset — Aug 2026 · computed 2026-08-10 · N = 20,516 · CSV
What the Lab publishes
Six things, all built from the same dataset: one annual report, two studies, eight province pages, the full named list of one-option communities, and a snapshot per city. Each card carries one figure from the page behind it.
Report · 2026-08-10 edition
1,074
of 2,175 communities (49.4%) have exactly one licensed program
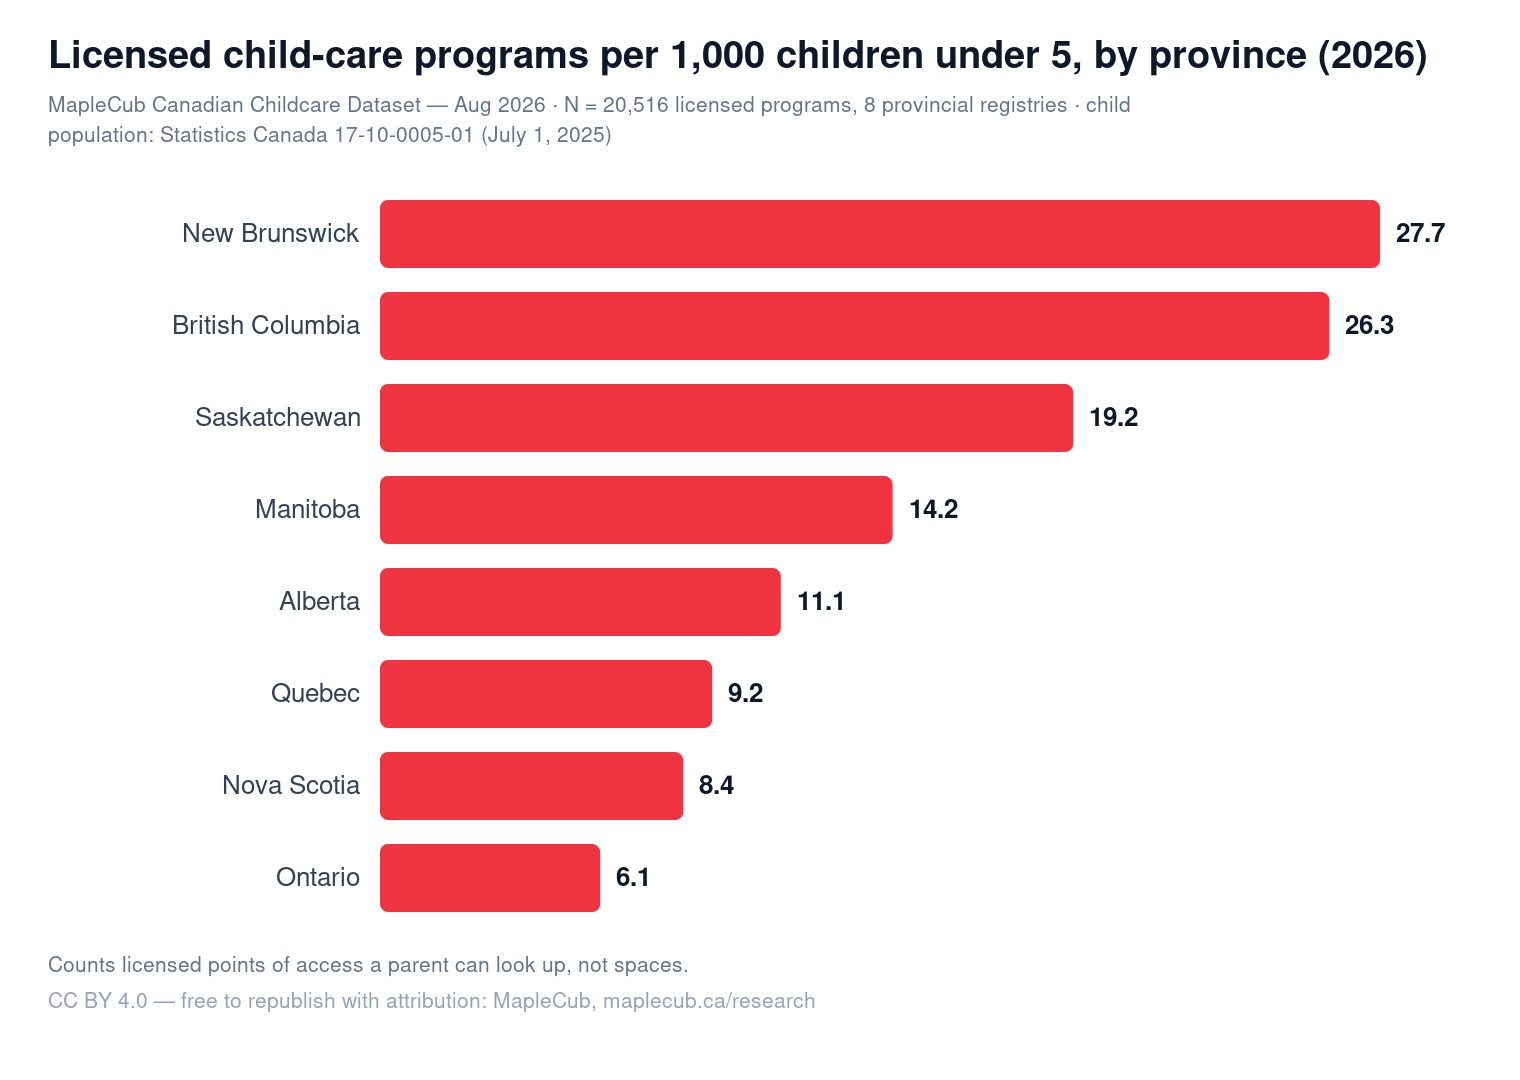
Eight provincial systems side by side: where the programs are, which communities have a single option, what a family actually pays after each province’s version of “$10-a-day,” and which governments publish inspection findings at all. New Brunswick leads on supply density at 27.7 programs per 1,000 children under five; three of eight provinces publish licensed capacity as open data, 479,782 spaces in total.
Study · 2026
3 of 8
provinces whose registry identifies which programs are in the fee program
Where reduced-fee participation can be measured from public registry data — Quebec (73.9% subsidized), New Brunswick (67.7% designated), British Columbia (96.5% CCFRI-authorized, which is a fee reduction and not a $10 rate) — and the five provinces where the published file cannot tell a parent which programs offer the reduced fee at all.
Study · six-city pilot
93
Montréal, the top of the pilot, on 52.1% hours coverage
How well each city’s licensed care fits a standard work day, computed only from measured opening and closing times. 2 of the six pilot cities are published with no score at all because their hours coverage is too thin to say anything honest — the refusal rule is part of the method, not a gap in it.
Study · full named list
1,031
communities named and linked, one page per province
Every community where licensed child care means exactly one door, by name, linked to the program that serves it. Not a percentage: the places. Registry artefacts are itemised on each province page rather than quietly corrected.
Source: MapleCub Canadian Childcare Dataset — Aug 2026 · computed 2026-08-10 · N = 20,516 · CSV
Data by province
One page per province: how many licensed programs, supply per 1,000 young children, what parents pay, what the registry does and does not publish, and the government sources behind every external figure.
Per-1,000 counts licensed points of access a parent can look up, not licensed spaces: some provinces license each family home individually, others license home care through agencies that never appear as separate records.
Source: MapleCub Canadian Childcare Dataset — Aug 2026 · computed 2026-08-10 · N = 20,516 · CSV · child population denominators: Statistics Canada 17-10-0005-01
City snapshots
One page per city, computed from the dataset: provider mix, how much of the sector has known ages and hours, and what the registry can — and cannot — say about reduced fees. 6 of 30 cities are published so far.
Source: MapleCub Canadian Childcare Dataset — Aug 2026 · computed 2026-08-10 · N = 20,516 · CSV · figure beside each city: its licensed programs
Download the dataset
One row per province, with program counts, provider mix, the address-level and centroid split of its coordinates, communities and one-option communities, concentration in the top five cities, published licensed capacity, StatCan child population, how many of its listings publish an age band and how many of those are school-age-only, and Google-presence signals reported as match coverage. New Brunswick’s presence fields are left empty rather than zero: the province joined the dataset on 2026-08-09 and has not been through the Google matching step, so the presence denominator is the 19,569 programs in the other seven provinces. On geocoding the file carries two numbers rather than one: 99.8% of listings hold a coordinate, and 45.9% of those are a street address rather than a postal-district centroid.
Machine-readable JSON for developers: /data/state-of-child-care-2026.json.
Source: MapleCub Canadian Childcare Dataset — Aug 2026 · computed 2026-08-10 · N = 20,516 · CSV
How the data is built
Sources, deduplication, geocoding, how communities are defined, how conservatively we match Google records, which denominators come from Statistics Canada, and the things MapleCub refuses to compute from inspection data. The methodology page also carries the Lab’s full source list: every government page behind every external figure, with the date we fetched it.
For journalists and researchers
Happy to pull a custom cut: one city, one province, a time series across editions, or a figure confirmed before you print it. Email hello@maplecub.ca and a person will answer you directly.
Cite as: MapleCub, “The State of Licensed Child Care in Canada, 2026,” 2026-08-10 edition. https://doi.org/10.5281/zenodo.21909631